Fatal Injuries From Accidents at Work 2017
Posted on August 8, 2017
This report provides total numbers of fatal injuries arising from accidents at work in Great Britain that were reported to the authorities in 2016/17. It includes fatal injuries to both workers and also to members of the general public.
Fatal injuries are thankfully rare events. With a degree of chance and randomness to the annual count, this results in an element of natural variation from one year to the next. The information features only cases of fatalities that the authorities have judged as fulfilling the reporting criteria defined in the Reporting of Injuries, Diseases and Dangerous Occurrences Regulations (RIDDOR). Two exclusions from these statistics are fatal diseases and fatal accidents on non-rail transport systems.
Fatal injuries to workers by main industry
Construction and agriculture tend to come out worst as they account for the greatest number of fatalities each year.
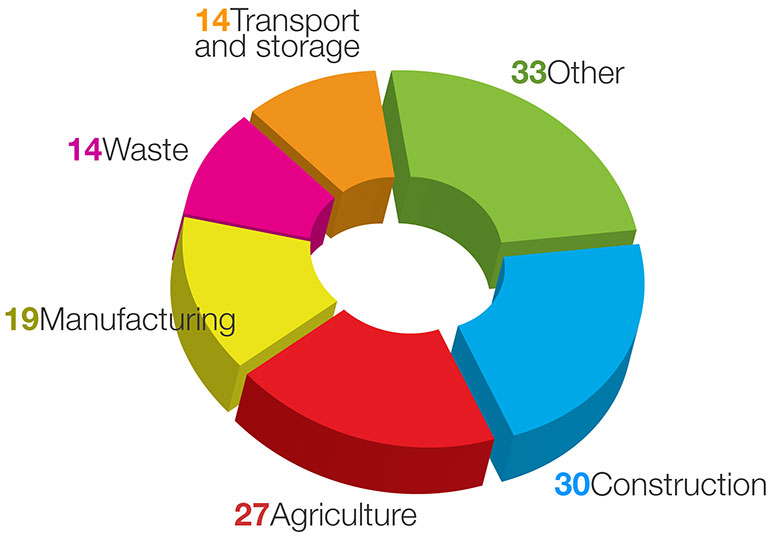
The number of fatalities in construction in 2016/17p (30) is the lowest number on record for the sector.
However, over the last five years the number has fluctuated, with 47 fatalities in 2015/16 compared with 35 in 2014/15. The annual average for the past five years is 39.
The number of fatal injuries in waste & recycling in 2016/17p (14) is almost double the annual average for the past five years (8) and compares with 6 deaths in 2015/16. While fatal numbers for the sector have fluctuated in recent years, this increase in the current year is largely explained by a single incident which resulted in 5 deaths.
The injury cases in ‘Other’ sectors in 2016/17 include:
- Communication, Business Services & finance (8)
- Public administration, education, human health & social work activities (6)
- Mining & quarrying (4)
- Electricity, Gas, Steam & Air Conditioning (3)
Injuries by gender and age
In 2016/17, 133 (97%) of all worker fatalities were male, a similar proportion to earlier years. In terms of age, around a quarter of fatal injuries in both 2016/17 (also since 2012) were to workers aged 60 and over, even though this is only approx 10% of the workforce.
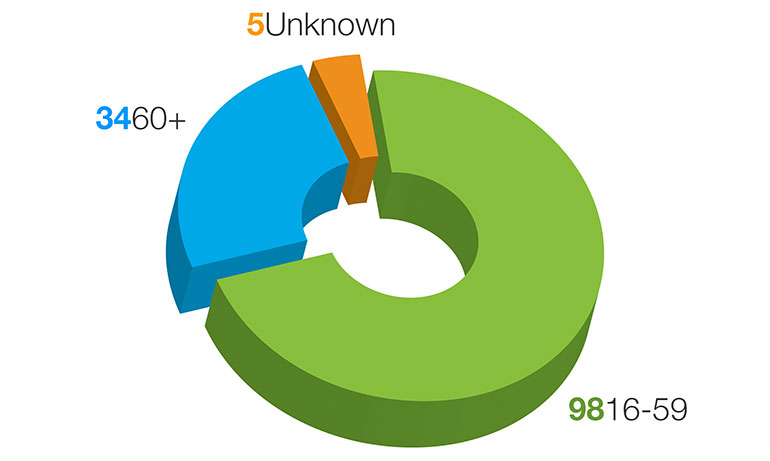
The rate of fatal injury increases with age, with workers aged 60-64 having a rate almost double the all ages rate, and workers aged 65 and over a rate around four times greater than the all ages rate. While this age gradient in rate is most strongly seen in agriculture, it is also present across a range of other sectors too.
Injuries by accident kind
Around three-quarters of fatalities in both 2016/17 and the combined five year period 2012-17 are defined by 6 different accident kinds. Being struck by moving vehicles, falls from a height and being struck by a moving, including flying or falling, object continue as the three main causes of fatal injury, accounting for over half of all fatalities every year since 2001/02.
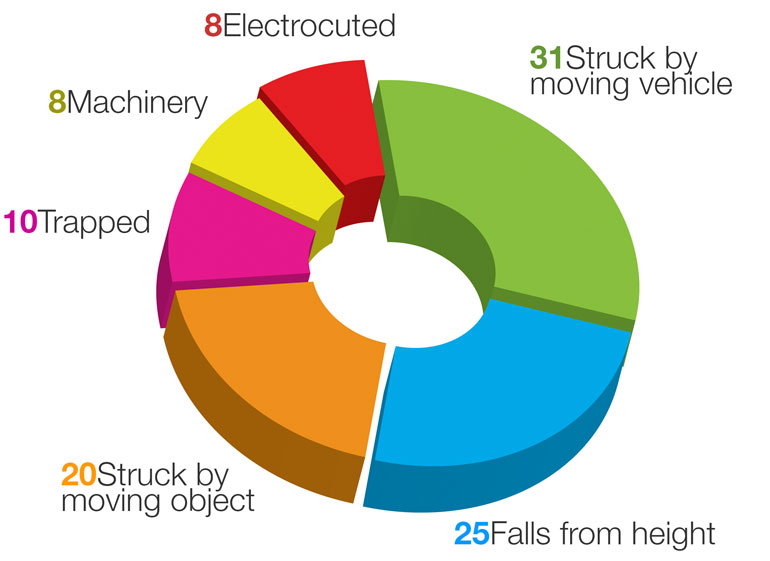
25 fatal injuries to workers were due to falls from a height. This is the lowest number on record and compares to 37 in 2015/16 and an annual average over previous 5 years of 40. This drop in the most recent year can be explained by natural variation in the figures. Being struck by a moving vehicle accounted for 31 fatal injuries to workers in 2016/17 compared with 28 in 2015/16 and an annual average of 25 over the last 5 years. The number of fatal injuries caused by being struck by a moving, including flying or falling, object has fluctuated between 14 and 20 in each of the last five years.
Source: HSE